Fresno County Department of Public Health has been providing a ‘dashboard’ of county covid-19 statistics updated bi-weekly on their website. Partway through December, though, the site ceased displaying information as it underwent a revamping. Even before the data site was removed, Coalinga Press asked FCDPH several times to clarify the population included in the case statistics. Coalinga residents wanted to know if the numbers being published included inmates at Pleasant valley State Prison and the California State Hospital. The response from FCDPH was still vague although there were graphs provided which could be interpreted to signify that the numbers published, indeed, did include PVSP and CSH Coalinga.
Today, FCDPH posted a link to a temporary source for recent Covid-19 data for Fresno County. based on the information received from FCDPH earlier (the graphs which are posted at the bottom of this article), readers may believe the total counts include the population of PVSP and CSH Coalinga although this has NOT been confirmed.
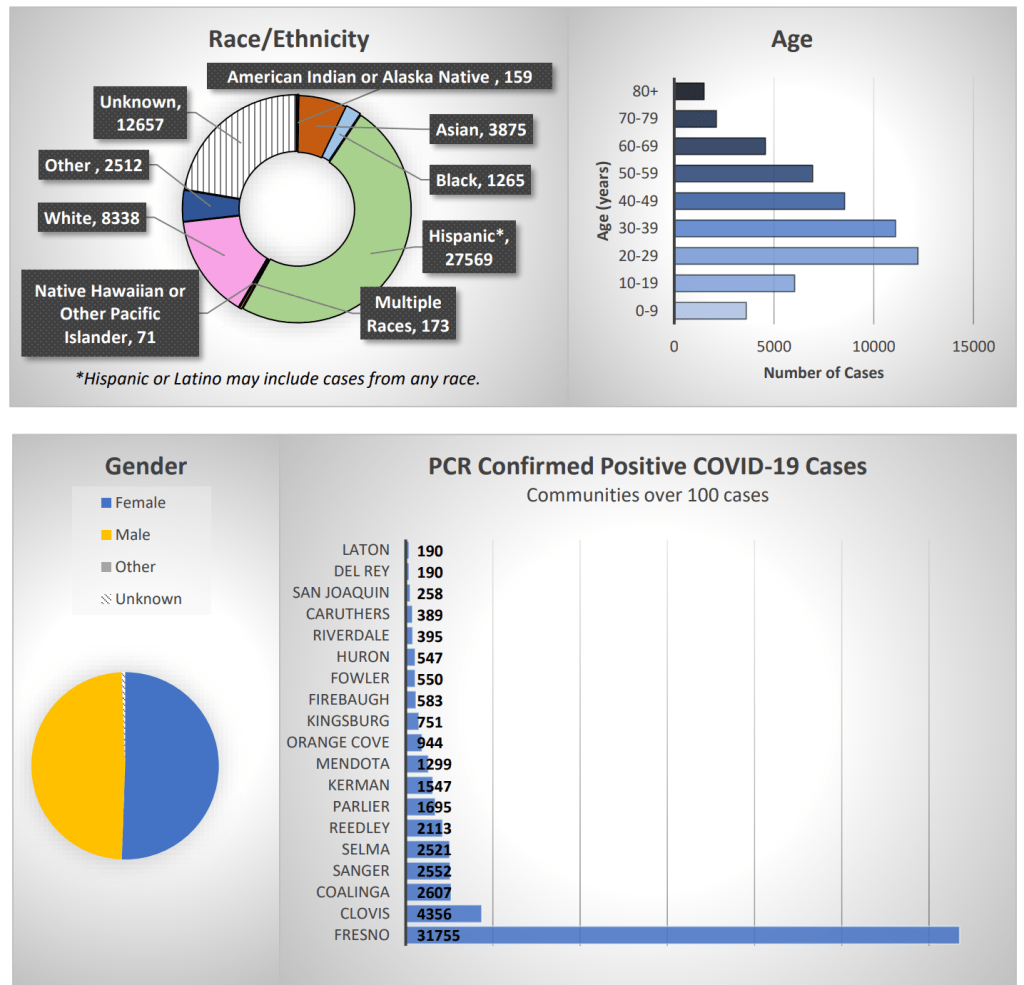

This date shows a cumulative total of 2,607 cases of Covid-19. Of those, 1,975 cases occurred at PVSP and those were classified as “resolved” meaning those individuals no longer have the disease. Another 35 inmates still have the illness and an additional ten were released while ill. Three inmates died from covid-19 while in custody at PVSP.
At California State Hospital Coalinga, there have been 358 cumulative cases of covid-19 among the general population with another 315 among the staff. It is not clear how many staff members who had covid-19 live in Coalinga.
Adding the totals from PVSP and CHS, there are 2,333 covid-19 cases. This would indicate that there have been a mere 274 cases among the residents of Coalinga itself. There is ambiguity in the number reporting, though, so it is impossible to conclude anything definite. Coalinga Press continues to pursue the entire summary of cases in Coalinga.
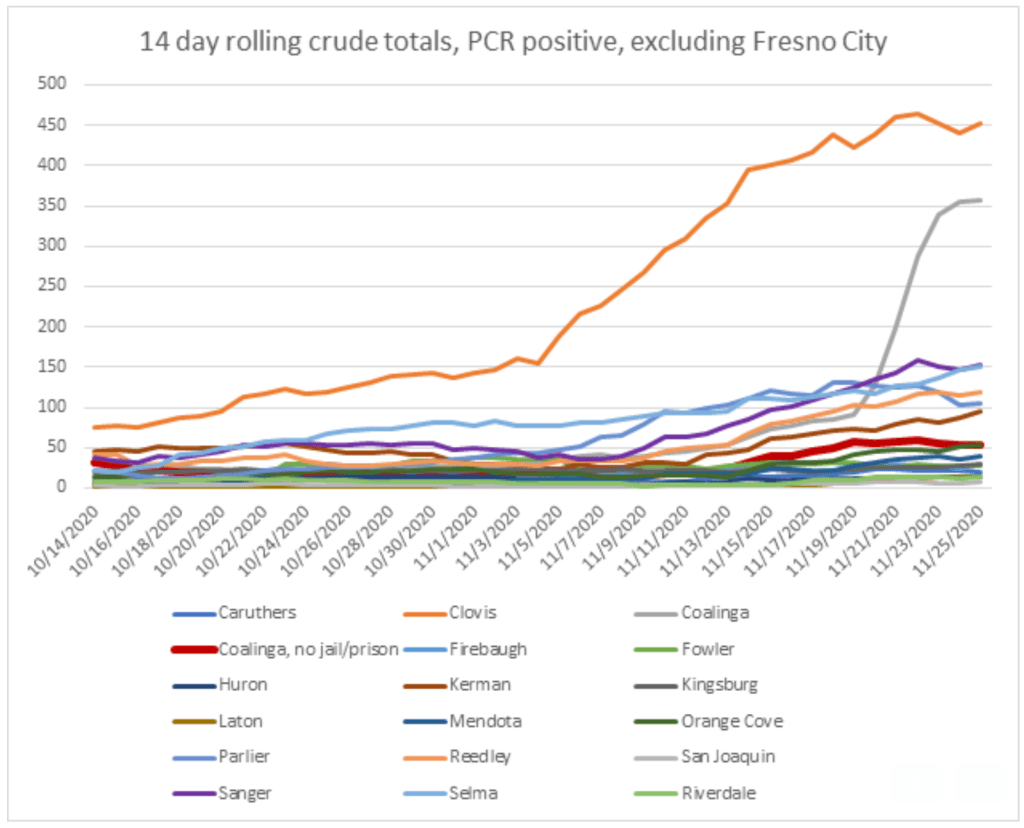
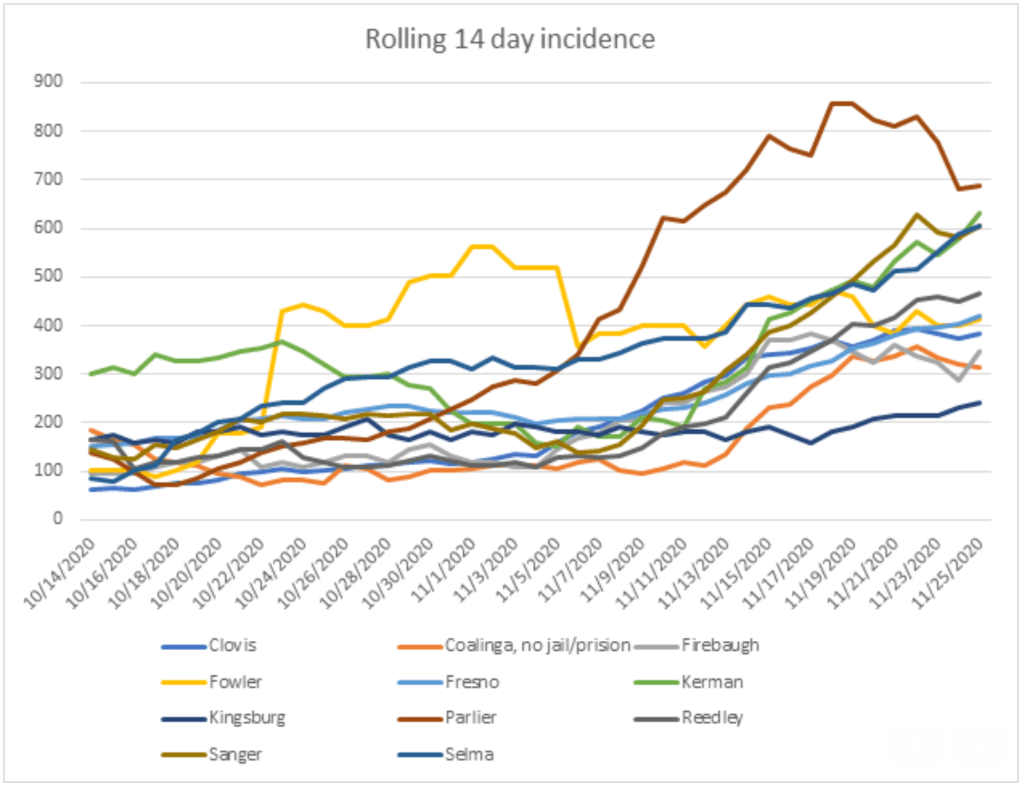
The three graphs below show the growth of case data for the specified dates on each. The first graph shows Coalinga clustered on the graph so closely to other communities that the yellow line is buried. That is the indicator which does not include prison or state hospital. The gray line shows the gross Coalinga total (including PVSP and CSH).